5 Root Causes of Reporting Gaps After Enterprise Integration
You spend months integrating your marketing platform with your customer relationship management (CRM) and analytics. The week the platform goes live, the marketing team reports 150 new leads for the month and the CRM shows 100. Finance asks you which number to trust. Nobody changed the data; the systems just disagree.
That disagreement is a reporting gap, and it’s one of the most common and frustrating outcomes of an enterprise integration. The systems are connected, but the numbers still don’t line up, and every downstream decision inherits the confusion.
A reporting gap is not a business-intelligence (BI) problem you can fix in a dashboard. It’s an integration problem, and it almost always traces back to one of five root causes. This guide walks through all five and shows you how to diagnose and fix each one. When you get them right, every team reports from the same numbers instead of arguing about whose data is correct.
Key Topics
- An integration problem, not a dashboard problem: trace reporting gaps back to how your systems connect and define data, not to your BI tool
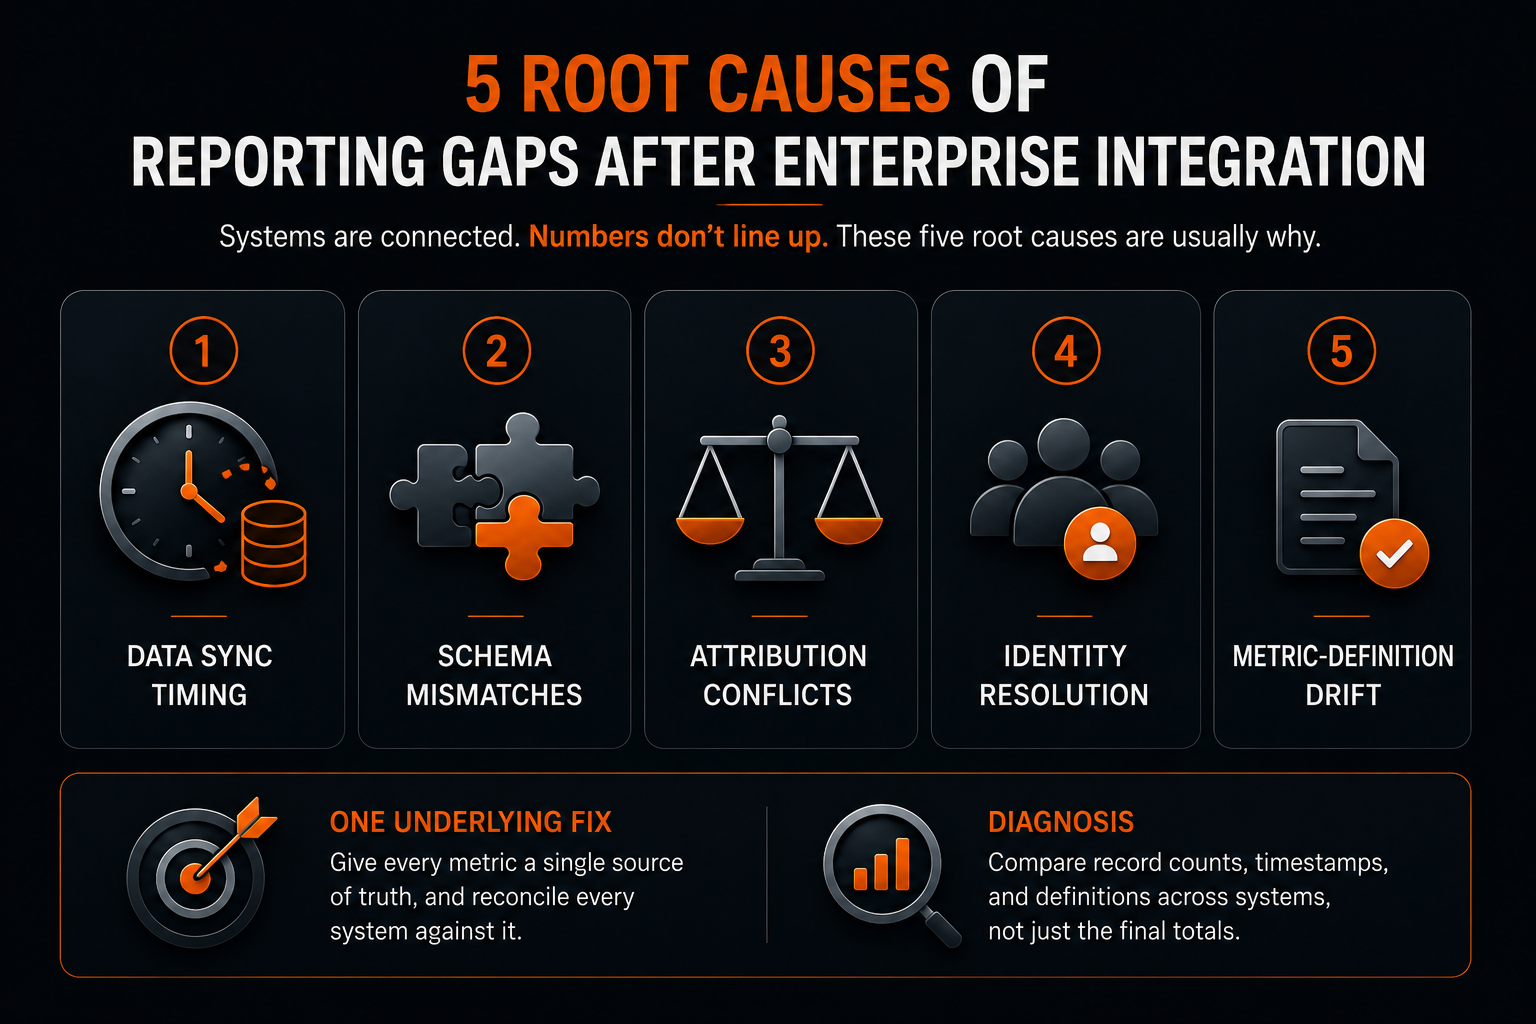
- Five root causes: identify data sync timing, schema mismatches, attribution conflicts, identity resolution and metric-definition drift
- One underlying fix: give every metric a single source of truth, and reconcile every system against it
- Diagnosis: compare record counts, timestamps and definitions across systems, not just the final totals
What Causes Reporting Gaps After Enterprise Marketing System Integrations?
Any reporting gaps after an integration will stem from the five root causes listed above. Each gap produces a different number in a different system, even when the underlying data is correct.
The scale of the problem is easy to underestimate. According to Gartner’s 2025 Marketing Technology Survey, organizations actively use only 49% of marketing technology tools, and just 15% of organizations qualify as high performers. Most enterprises run a sprawling, half-used stack of systems that don’t have the design structures to agree with each other. When you connect these systems, the disagreements surface as reporting gaps.
Below is how each root cause affects reporting gaps and how to fix it.
Why Does Data Sync Timing Cause Reporting Gaps?
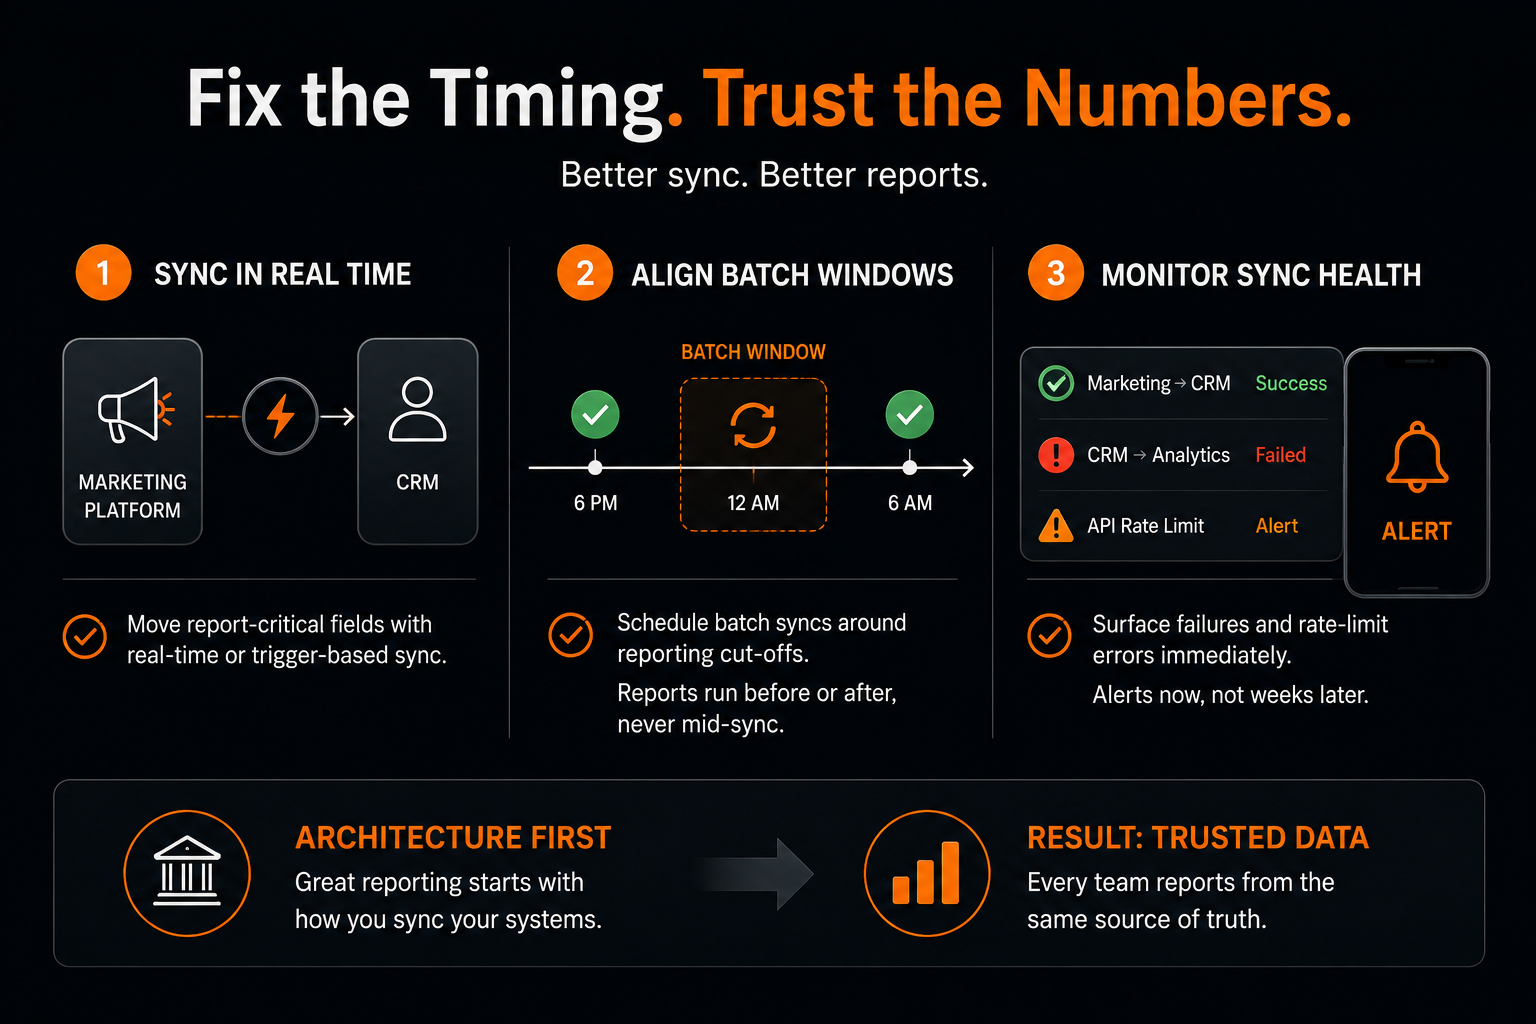
Data sync timing causes reporting gaps because your systems capture the same data at different moments, so a report run before a sync shows different totals than one run after. When data moves on a schedule instead of in real time, the two systems are almost never looking at the same picture.
Imagine a marketing platform that creates 100 new leads between 8 p.m. and midnight, with a sync to the CRM scheduled for 12:30 a.m. A sales rep runs a lead report at 11 p.m. and sees zero new leads because the batch hasn’t run. The marketing dashboard already counts all 100 leads. The CRM imports them after midnight, and now it reports 100 leads for the same day that the sales team reported none. The leads exist in both systems, but the timing alone created a 100-lead gap.
Failed and partial syncs add to the problem. When an integration hits an application programming interface rate limit, the job can pause mid-run, which leaves a contact created in one system but the related deal missing in the other. Those orphaned records and dropped updates accumulate into a persistent divergence between the two totals.
How to fix it
Move report-critical fields to real-time or trigger-based sync so they update the moment they change, and align batch windows to your reporting cut-offs so a report never lands mid-sync. Then monitor sync health. Failed jobs and rate-limit errors should raise an alert, not surface weeks later in a broken report. This is an architecture decision as much as a settings one, and it starts with how you synchronize CRM data across your systems.
How Do Schema and Data-Model Mismatches Break Reporting?
Schema mismatches break reporting when two systems store the same information in different structures, so the same record gets split, duplicated or defined differently across systems. Even when your systems receive the same data, they don’t always interpret the data the same way.
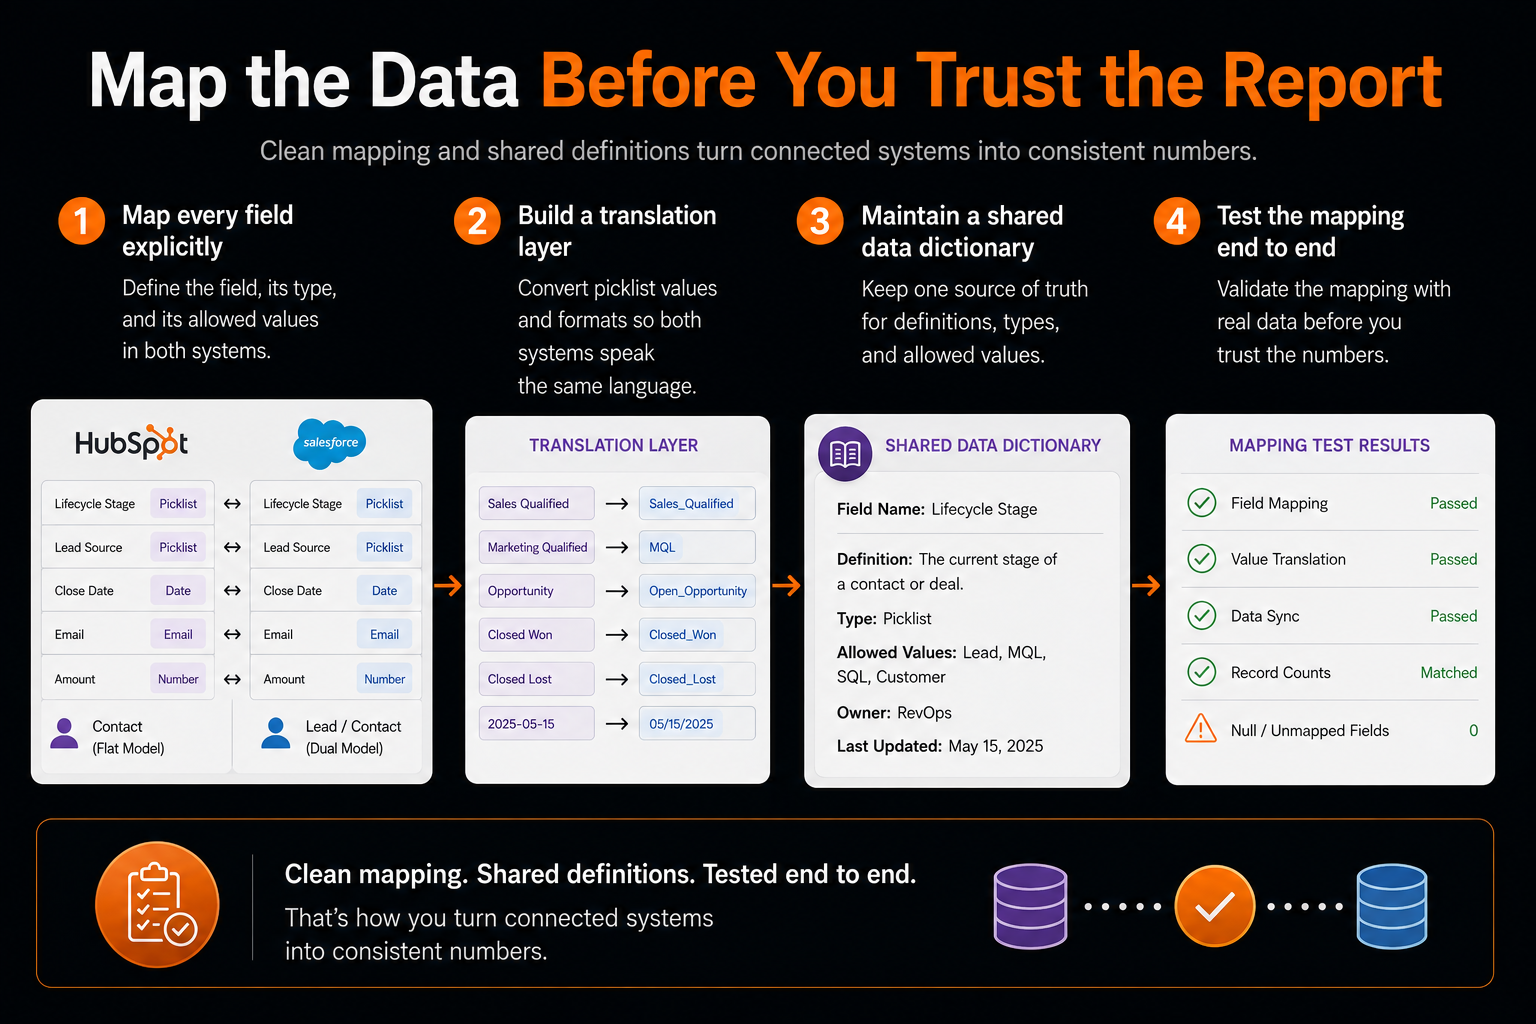
The classic case is object models that don’t line up. HubSpot uses a flat model where every person is a Contact. Salesforce uses a dual model where an unqualified lead is a separate Lead object until it converts. When syncing the two without careful design, one HubSpot Contact can become a Salesforce Lead that never matches the existing Contact, which splits one person into two records. The result: HubSpot reports 300 contacts, while Salesforce reports 250 Contacts plus 60 Leads.
Field-level mismatches quietly do the same. If HubSpot sends a lifecycle stage of “Sales Qualified” but Salesforce only accepts “Sales_Qualified,” the system rejects the value and stalls the record, so your structured query language (SQL) counts drift apart. Date formats and picklist values cause the same kind of rejection.
How to fix it
Map every field explicitly, including its type and its allowed values, and build a translation layer that converts one system’s picklist values into the other’s. Maintain a shared data dictionary so both systems agree on what each field means. Test the mapping end to end before you trust the numbers, because an audit that turns up thousands of null fields is usually a schema mismatch in disguise.
Why Do Attribution Models Make the Numbers Disagree?
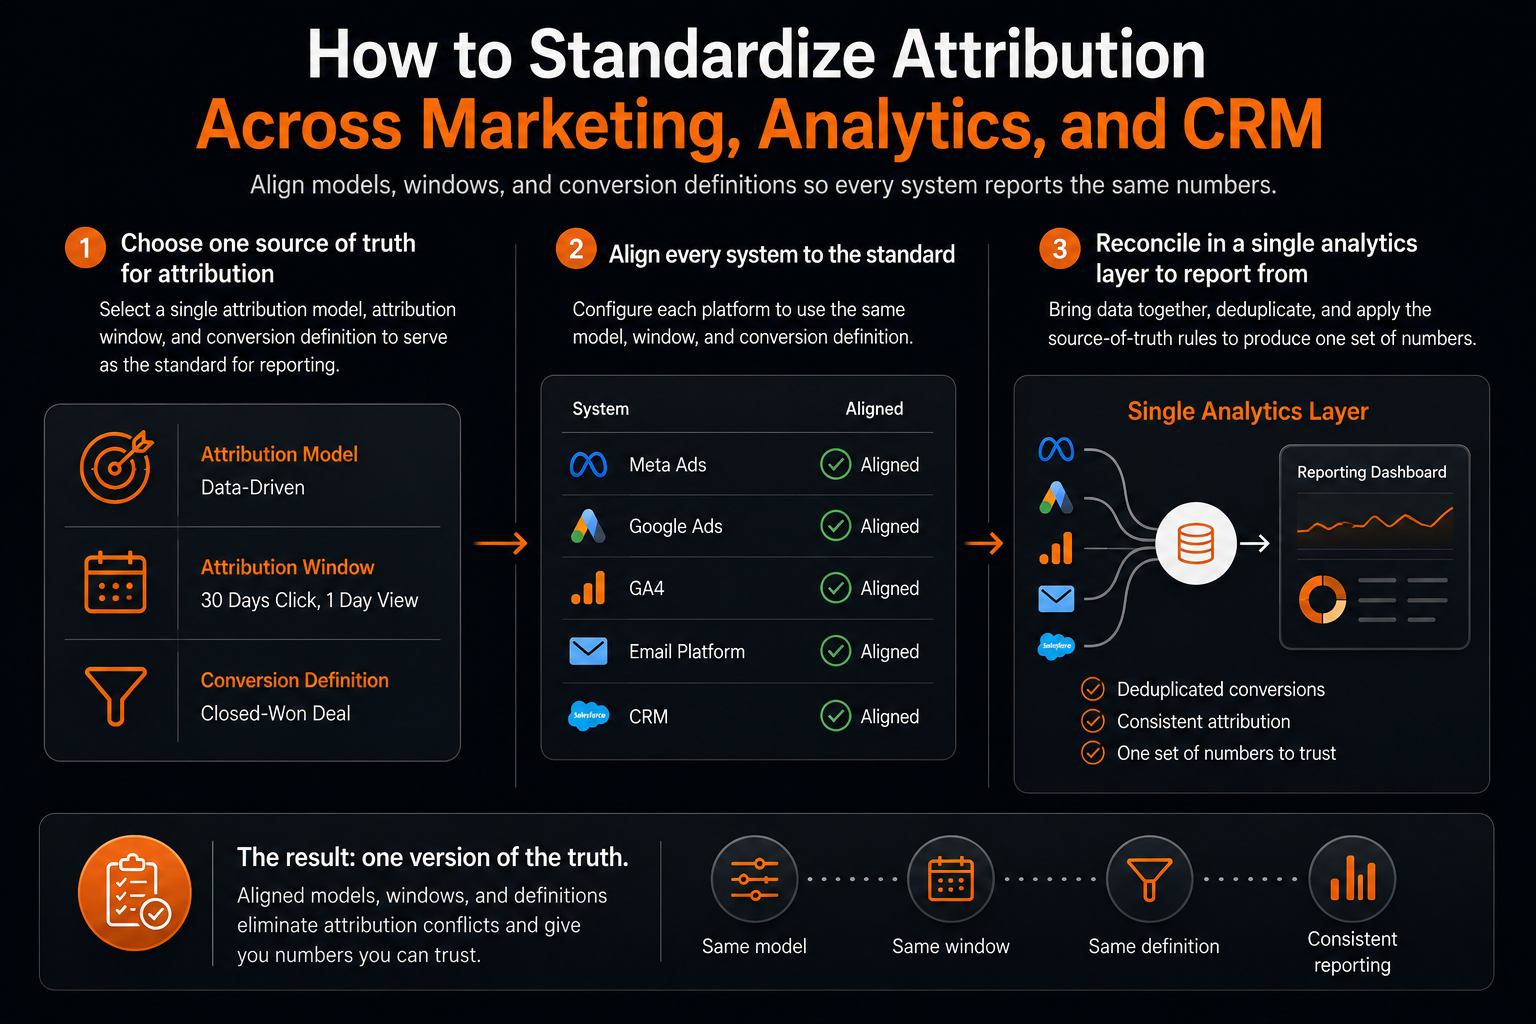
Attribution models cause disagreements in the data because each system credits conversions by its own rules, so several systems count the same sale and create unrealistic totals. Every platform in the stack has its own perception of who earned the conversion.
Consider a single customer journey: a viewed Facebook ad, a clicked Google search ad, an email click and then a purchase. Meta reports it as a view-through conversion, Google Ads credits the click, Google Analytics 4 splits the credit and the CRM records the source as “email” since that was the last touch. Each is correct from its own vantage point. Add the ad platforms together, and you might see 70, 58 and 44 conversions for one sale, a total far higher than the number of actual customers.
Attribution windows widen the gap further. One platform credits any click within seven days. Another uses a 30-day lookback, so a conversion appears in one report and not the other purely on timing. Definitions matter too: if “conversion” means a form fill in one tool and a closed-won deal in another, comparing 100 form submissions to 28 opportunities is not an error; it’s two different funnel stages.
How to fix it
Choose one attribution model as the source of truth for reporting, and align every system’s attribution window and conversion definition to match it. Where full parity isn’t possible, reconcile the numbers in a single analytics layer to report from, rather than trusting each platform’s self-reported credit.
How Does Duplicate and Unmatched Data Distort Your Counts?
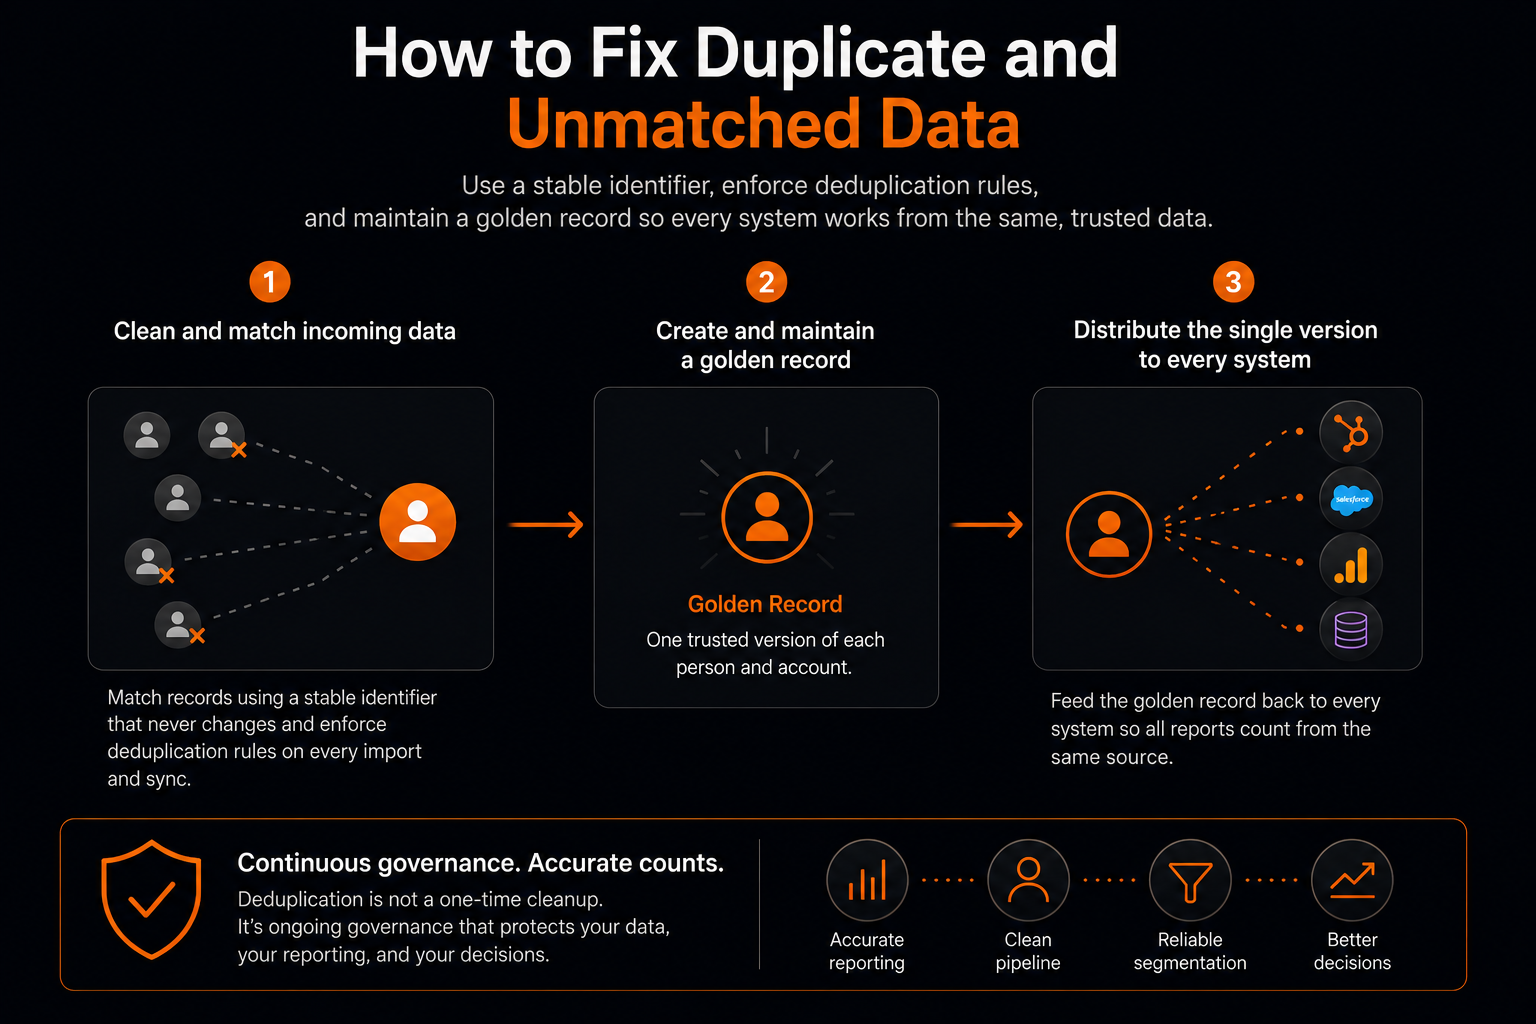
Duplicate and unmatched records distort counts because the system stores the same person or account more than once or fails to match records across systems, which causes inflated totals or missing data. Identity is the link that holds an integration together, and it breaks more easily than most teams expect.
Systems match records on keys such as “email” or “name plus company.” When the keys don’t line up exactly – an uppercase in an email address or a missing company name – the sync creates a new record instead of updating the existing one. Those phantom duplicates double-count leads and pipeline. CRMs without strict deduplication commonly carry 10-30% duplicate records, so 1,000 synced leads can land as 1,100 contacts. Now your “contacts created” report is off by 100 before anyone reviews it.
The reverse also happens. When a marketing lead can’t find a matching CRM record, the integration may hold or drop it, so the marketing side reports more than the CRM. In business-to-business models, contact-to-account matching adds another layer: if the account doesn’t exist or has a different name, contacts scatter across the wrong accounts.
How to fix it
Match records using a stable identifier that never changes (not just email), and enforce clear deduplication rules on every import and sync. For complex stacks, a mobile device management (MDM) or customer data platform (CDP) can maintain a golden record for each person and account, then feed that single version back to every system. Deduplication is continuous governance rather than a one-time cleanup.
Why Do Inconsistent Definitions Create Reporting Gaps?
Inconsistent definitions create reporting gaps because teams and systems count the same record differently, so both numbers are correct and don’t match. This is the root cause that people most often mistake for a bug.
For example, take the marketing qualified lead (MQL). Marketing might count every lead above a scoring threshold, while the sales group only counts the leads reviewed and accepted by a rep. Marketing reports 150 MQLs, sales reports 80 and both are correct. They are simply counting different things. Campaign taxonomy fragments the same way: “facebook,” “Facebook,” “meta” and “paid-social” in UTM tags split one channel into four rows, so the numbers under the intended label collapse.
Time and money add their own drift. If marketing analytics runs on Coordinated Universal Time and the CRM on Pacific Time, a conversion near midnight lands on different days in each system. Therefore, daily reports disagree even when the weekly totals match. Currency conversion differences do the same to revenue numbers.
How to fix it
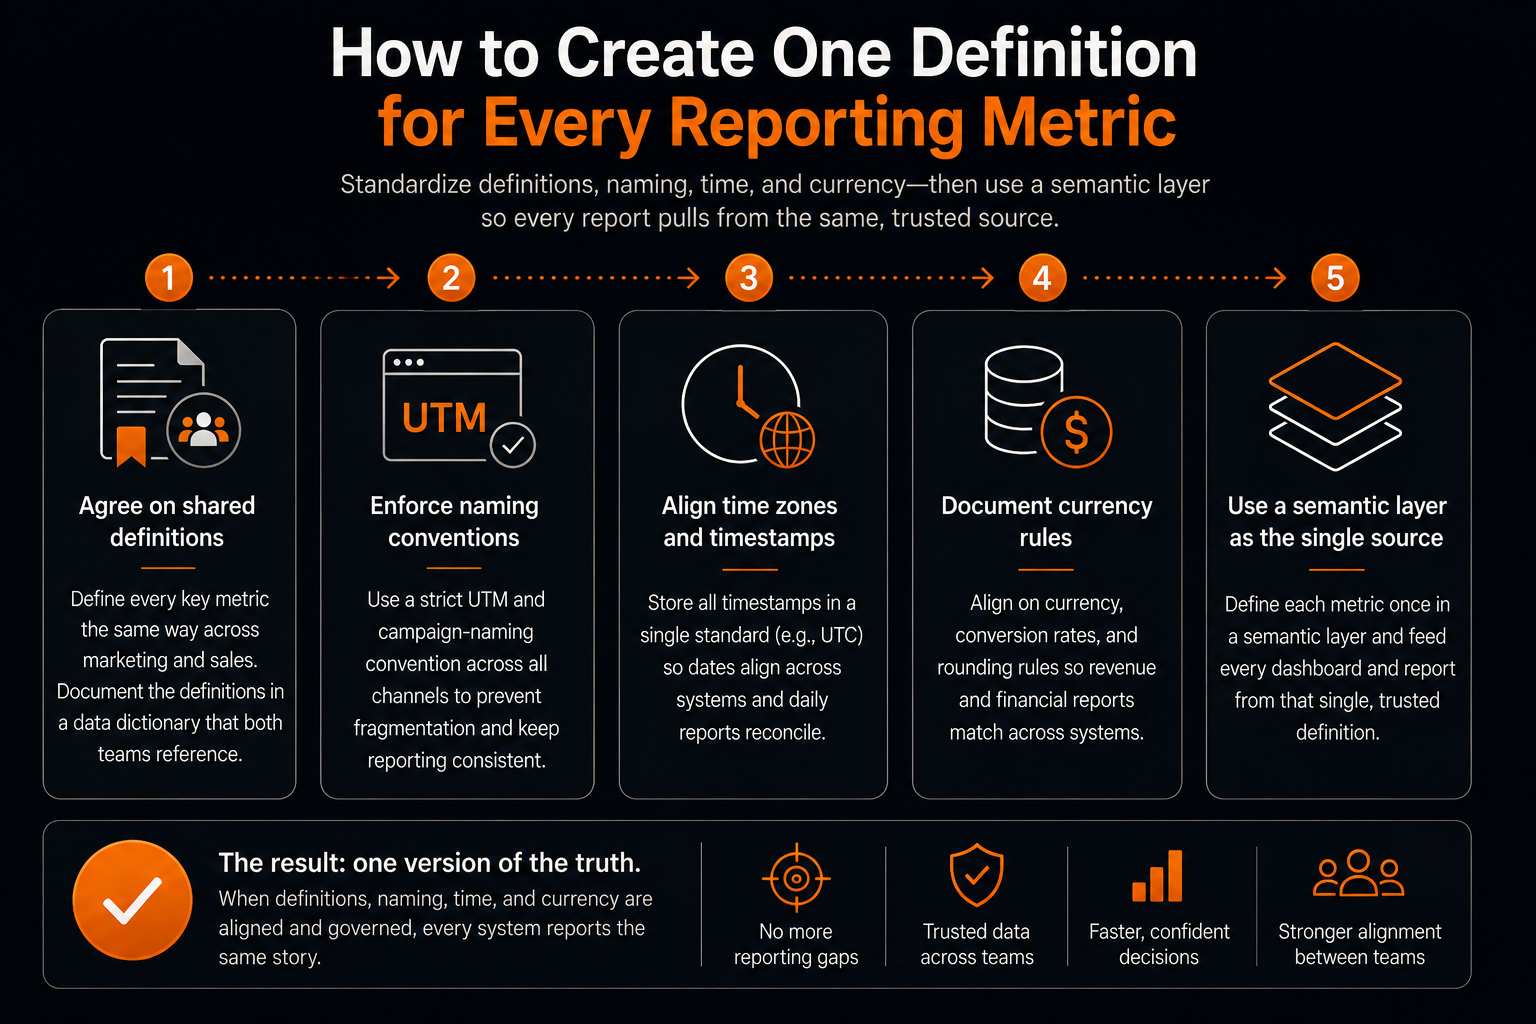
Agree on shared definitions for every key metric, and record them in a data dictionary that marketing and sales teams both reference. Enforce a strict UTM and campaign-naming convention. Align time zones by storing timestamps in a single standard, and document any currency rules. A semantic layer that defines each metric once and then feeds every dashboard is the durable version of this fix.
How Do You Diagnose a Reporting Gap?
Diagnose a reporting gap by reconciling the same metric across systems over the same time window, then narrow down which of the five causes is responsible. Reconciliation means comparing two data sets on a shared key or timeframe and finding where they diverge.
The practical toolkit:
- Record-count audits: count the key object in each system for the same window (new leads in the marketing platform vs new contacts in the CRM, by day). This is easiest to do in a data warehouse, where you replicate both systems and compare the counts side by side. Daily mismatches point to timing, while steady ones point to schema or identity.
- Field-level differences: Take a sample of records that should exist in both systems, and compare their field values. Mismatched or missing fields expose mapping and picklist problems.
- Funnel-stage reconciliation: Compare counts at each transition (MQL to SQL to opportunity). A drop-off that’s larger than expected shows where a system is losing or filtering records.
- Attribution audits: Trace a few real customer journeys, and check how each system credited them. Temporarily aligning every tool to the same window and model shows whether the numbers then converge.
- Sync-log inspection: Check the integration logs for issues such as errors and rate-limit warnings. Also check for paused jobs during the period in question.
- Data observability: Automated checks such as volume or schema-change alerts catch gaps before a person notices them in a report.
How Do You Prevent Reporting Gaps for Good?
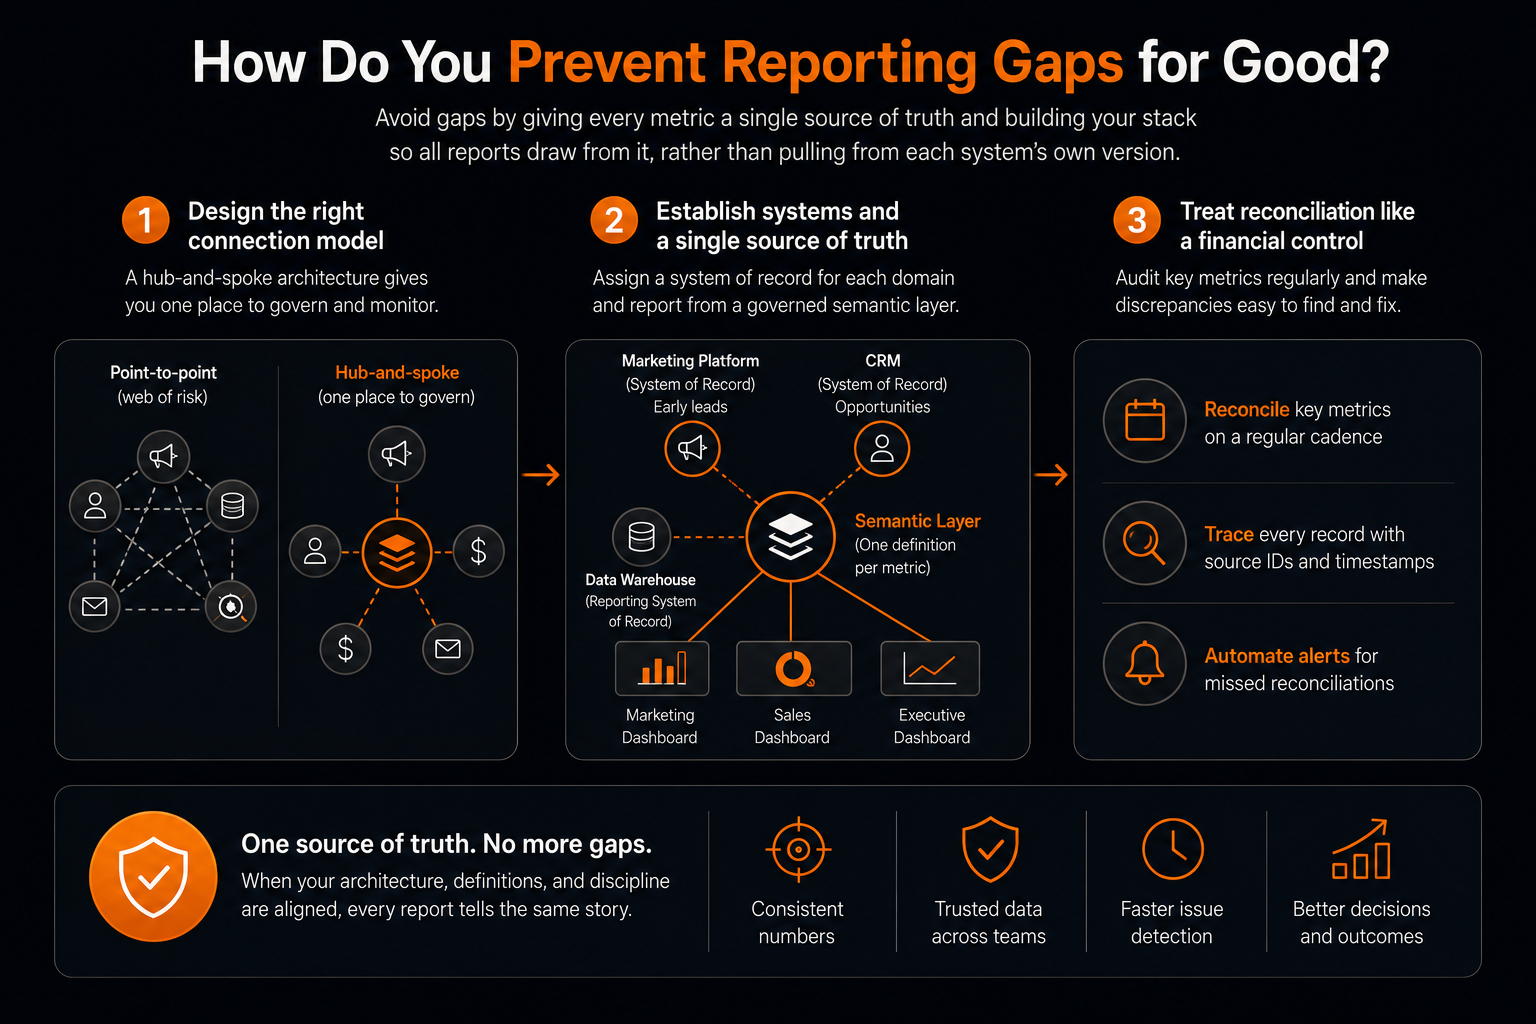
Avoid gaps in your reporting by giving every metric a single source of truth and building your stack so all reports draw from it, rather than pulling from each system’s own version. Prevention is architecture and discipline, not a better dashboard.
Start with the connection model. A web of point-to-point integrations multiplies the places data can diverge, while a hub-and-spoke model, where every system connects through a central layer, gives you one place to govern and monitor. This is the same architecture choice that governs how you synchronize CRM data across teams.
Then name a system of record for each domain – the marketing platform for early leads and the CRM for opportunities – so no two systems fight to be the truth. Feed all of it into a data warehouse that serves as the reporting system of record, with a governed semantic layer that defines each metric once. Every dashboard draws from that shared layer, so the numbers agree by construction.
Finally, treat reconciliation like a financial control. Run a regular audit of your key metrics across systems, and keep source IDs and timestamps on every record so a discrepancy can be traced. Allow missed reconciliations to raise alerts on their own.
Fixing Reporting Gaps Boils Down to One Source of Truth
A reporting gap is rarely a mystery once you know where to look. You find gaps by reviewing sync timing, schema, attribution, identity or definitions, and each one is fixable. The solution is not in the dashboard but rather in the architecture underneath it: one source of truth per metric, one place that defines each metric and one connection model you can govern.
When you put those three in place, the disagreements stop before they ever reach a report. Marketing, sales, and finance stop meeting to reconcile the numbers and start meeting to act on them, because the figure no longer changes depending on which system you ask, or when you ask it.
The place to start is the metrics that drive decisions: leads, pipeline, revenue. Give each one a clear owner and a single definition before you move to the next, and reconcile everything against it. Do that, and reporting stops being something your teams argue over and becomes something they build on.
That is the real return on an integration done well: one trusted set of numbers every team can plan from, no matter which system they open.
Frequently Asked Questions
Why don’t my marketing and sales numbers match after an integration?
Almost always because of one of five causes: sync timing, schema mismatches, attribution differences, duplicate or unmatched records, or different definitions of the same metric. Usually there is no bug; the systems are counting the same records in different ways.
What’s the difference between a data sync issue and a schema issue?
A sync issue is about timing and delivery: for example, the data is late or partial. A schema issue is about structure: the data arrives, but each system stores or maps it differently.
Which system should own attribution?
One system should own it, and every other system should defer to it. Two systems running their own attribution models will always disagree. Many teams reconcile attribution in a warehouse or analytics layer and report from there.
Do I need a data warehouse to fix reporting gaps?
Not always, but it’s the most durable fix. A warehouse lets you reconcile every system against one source and define each metric once so that all reports agree. Smaller stacks can get by with disciplined mapping and governance.
How often should I reconcile my systems?
Treat it as a recurring control. A monthly audit of key metrics across systems is a reasonable baseline, with automated freshness and volume checks running continuously in between.
By: Harry Maule